UNITED STATES
SECURITIES AND EXCHANGE COMMISSION
Washington, D.C. 20549
SCHEDULE 14A
Proxy Statement Pursuant to Section 14(a) of the Securities
Exchange Act of 1934 (Amendment No. )
Filed by the Registrant xý Filed by a Party other than the Registrant o¨
Check the appropriate box:
| ¨ | Preliminary Proxy Statement | |
| ¨ | Confidential, for Use of the Commission Only (as permitted by Rule 14a-6(e)(2)) | |
| ý | Definitive Proxy Statement | |
| ¨ | Definitive Additional Materials | |
| ¨ | Soliciting Material Pursuant to §240.14a-12 | |
Raven Industries, Inc.
(Name of Registrant as Specified In Its Charter)
| (Name of Person(s) Filing Proxy Statement, if other than the Registrant) | |||
Payment of Filing Fee (Check the appropriate box):
| ¨ | No fee required. | |
| ¨ | Fee computed on table below per Exchange Act Rules 14a-6(i)(1) and 0-11. | |
| (1) | Title of each class of securities to which transaction applies: | ||
| (2) | Aggregate number of securities to which transaction applies: | ||
| (3) | Per unit price or other underlying value of transaction computed pursuant to Exchange Act Rule 0-11 (set forth the amount on which the filing fee is calculated and state how it was determined): | ||
| (4) | Proposed maximum aggregate value of transaction: | ||
| (5) | Total fee paid: | ||
| ¨ | Fee paid previously with preliminary materials. | |
| ¨ | Check box if any part of the fee is offset as provided by Exchange Act Rule 0-11(a)(2) and identify the filing for which the offsetting fee was paid previously. Identify the previous filing by registration statement number, or the Form or Schedule and the date of its filing. | |
| (1) | Amount Previously Paid: | ||
| (2) | Form, Schedule or Registration Statement No.: | ||
| (3) | Filing Party: | ||
| (4) | Date Filed: | ||

205 E. 6th Street
Sioux Falls, South Dakota
Telephone 605-336-2750
April 12, 20112013
Dear Shareholder:
You are cordially invited to join us for our Annual Meeting of Shareholders to be held on Tuesday,Thursday, May 24, 201123, 2013 at 9:00 a.m. (Central Daylight Time) at the Ramkota Hotel and Conference Center, 3200 W. Maple Avenue, Sioux Falls, South Dakota.
The Notice of Annual Meeting of Shareholders and the Proxy Statement that follow describe the business to be conducted at the meeting. We will also report on matters of current interest to our shareholders.
Your vote helps to lower overall proxy costs and eliminates phone calls. Whether you own a few shares or many, it is important that your shares are represented. If you cannot attend the meeting in person, you may vote your shares as described in the following materials.
We look forward to seeing you at the meeting.
Sincerely,


RAVEN INDUSTRIES, INC.
205 E. 6th Street
P.O. Box 5107
Sioux Falls, South Dakota 57117-5107
NOTICE OF ANNUAL MEETING OF SHAREHOLDERS
MAY 24, 201123, 2013
| Time | 9:00 a.m. CDT on 23, 2013 | |
| Place | Ramkota Hotel and Convention Center, Amphitheater II 3200 W. Maple Avenue Sioux Falls, South Dakota | |
| Items of | (1) | Elect Seven Directors. |
| Business | (2) | A non-binding advisory vote to approve the compensation for our executive officers disclosed in this proxy statement. |
| (3) | Ratify the appointment of the Independent Registered Public Accounting Firm. | |
| (4) | Consider such other business as may properly come before the Annual Meeting or any adjournments thereof. | |
| Record Date | You are entitled to vote if you were a shareholder at the close of business on April | |
| Annual Meeting | If you are a shareholder, please come to the Annual Meeting and present proof of ownership of our stock at the registration table. The Annual Meeting is open to shareholders and those guests invited by the Company. | |
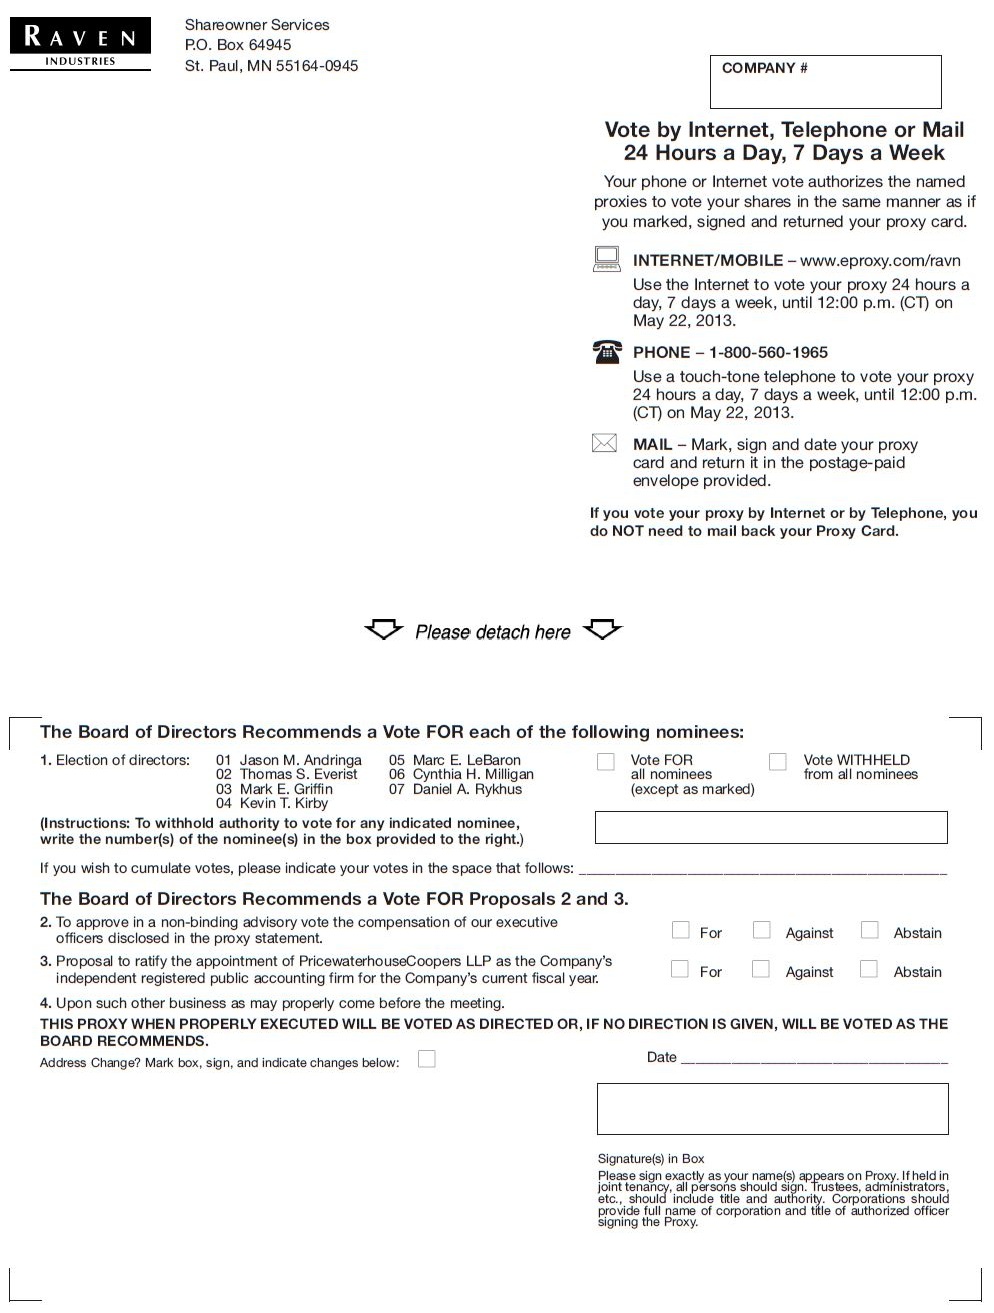
| Voting by Proxy | Please submit a proxy as soon as possible so that your shares can be voted at the Annual Meeting in accordance with your instructions. You may submit your proxy: | |
| (1) | over the Internet; | |
| (2) | by telephone; or | |
| (3) | by mail. | |
| For specific instructions, refer to page 1 of this proxy statement and the voting instructions on the proxy card. | ||
THIS PROXY STATEMENT AND PROXY CARD ARE BEING DISTRIBUTED ON OR ABOUT APRIL 12, 2011.2013.
By Order of the Board of Directors,
Secretary
| Important Notice Regarding the Availability of Proxy Materials for the Annual Meeting of Stockholders to be |
The Proxy Statement and the Annual Report are available at: http://investors.ravenind.com/financials.cfm |
| PROXY STATEMENT TABLE OF CONTENTS | |
| PAGE | |
| General | |
| Voting Securities and Proxies | |
| Ownership of Common Stock | |
| Election of Directors | |
| Say on Pay | |
| Ratification of Auditors | |
| Board of Directors and Committees | |
| Corporate Governance | |
| Non-Management Director Compensation | |
| Executive Compensation | |
| Compensation Discussion and Analysis | |
| Compensation Committee Report | |
| Equity Compensation Plan Information | |
| Summary Compensation Table | |
| Grants of Plan Based Awards in Fiscal | |
| Outstanding Equity Awards at Fiscal | |
| Option Exercises in Fiscal | |
| Potential Payments on Termination or Change-in-Control | |
| Independent Registered Public Accounting Firm Fees | |
| Audit Committee Report | |
| Other Matters | |
PROXY STATEMENT
of
RAVEN INDUSTRIES, INC.
205 E. 6th Street, P.O. Box 5107
Sioux Falls, South Dakota 57117-5107
Annual Meeting of Shareholders to be held
May 24, 2011
23, 2013
This Proxy Statement is furnished in connection with the solicitation of proxies by the Board of Directors of Raven Industries, Inc. (the “Company” or “Raven”) to be used at the Annual Meeting (the “Meeting”) of Shareholders of the Company, which is to be held on Tuesday,Thursday, May 24, 2011,23, 2013, at 9:00 A.M. (C.D.T.) at the Ramkota Hotel and Convention Center, Amphitheater II, 3200 West Maple Avenue, Sioux Falls, South Dakota. The approximate date on which this Proxy Statement and accompanying proxy were first sent or given to shareholders was April 12, 2011.2013. Each shareholder who signs and returns a proxy in the form enclosed with this Proxy Statement may revoke it at any time prior to its use by giving notice of such revocation to the Company in writing or in open meeting or by such shareholder giving a valid proxy bearing a later date. Presence at the meeting by a shareholder who has signed a proxy does not alone revoke the proxy. Only shareholders of record at the close of business on April 5, 20114, 2013 (the “Record Date”) will be entitled to vote at the Meeting or any adjournments thereof.
The Company has outstanding only one class of voting securities, Common Stock $1.00 par value, of which 18,078,90636,342,098 shares were outstanding as of the close of business on the Record Date. Shareholders representing a majority of the shares of Common Stock outstanding and entitled to vote must be present in person or represented by proxy in order to constitute a quorum to conduct business at the Meeting.
You are entitled to one vote for each share of Common Stock that you hold, except for the election of directors. IfWith respect to the election of directors, if you vote for all nominees, one vote per share will be cast for each of the seven nominees. You may withhold votes from any or all nominees. Except for the votes that shareholders of record withhold from any or all nominees, the persons nameddesignated as proxies in the proxy card will vote such proxy “FOR” and, if necessary, will exercise their cumulative voting rights to elect the nominees as directors of the Company. If you wish to cumulate your votes in the election of directors, you are entitled to as many votes as equal the number of shares held by you at the close of business on the Record Date, multiplied by the number of directors to be elected. You may cast, under the cumulative voting option, all of your votes for a single nominee or apportion your votes among any two or more nominees. For example, a holder of 100 shares may cast 700 votes for a single nominee, apportion 100 votes for each of nineseven nominees or apportion 700 votes in any other manner by so noting in the space provided on the proxy card. The cumulative voting feature for the election of directors is also available by voting in person at the Meeting; it is not available by telephone or on the internet.
In the election of directors, the seven director nominees who receive the highest number of votes will be elected as directors. In the advisory vote on our executive compensation and the vote to ratify the appointment of the independent registered public accounting firm, the approval requires the affirmative vote of a majority of the votes cast. A shareholder thatcast at a meeting at which a quorum is present or represented by proxy at the Meeting and who “abstains” with respect to such a proposal is in effect casting a negative vote, but a shareholder (including a broker) who does not give authority to a proxy to vote will not be considered present and entitled to vote on this proposal. In the advisory vote on the preferred frequency of advisory votes on executive officer compensation, a plurality of the votes cast will determine the preferred frequency of the advisory votes. In other words, the alternative of every one year, two years or three years that receives the most votes will be the frequency preferred by the shareholders.present.
2OWNERSHIP OF COMMON STOCK
The following table shows certain information regarding beneficial ownership of the Company’sCompany's common stock as of the Record Date by: (i) any person known by the Company to be the owner, of record or beneficially, of more than 5% of the Common Stock, (ii) each of the executive officers, directors and nominees for election to the Company’sCompany's Board of Directors, and (iii) all executive officers and directors as a group.
Name of beneficial owner | Non-voting stock units vested | Shares beneficially owned | Percent of class | |||||||
| Jason M. Andringa | — | — | * | |||||||
| Anthony W. Bour | 17,275 | 110,242 | (1,12) | * | ||||||
| Matthew T. Burkhart | 40,985 | (2) | * | |||||||
| Thomas S. Everist | 8,762 | 24,400 | (12) | * | ||||||
| Mark E. Griffin | 8,762 | 21,664 | (12) | * | ||||||
| Thomas Iacarella | 279,833 | (3) | * | |||||||
| Kevin T. Kirby | 7,269 | 20,000 | (12) | * | ||||||
| Marc E. LeBaron | 3,812 | 2,000 | (12) | * | ||||||
| Janet L. Matthiesen | 5,084 | (4 | ) | * | ||||||
| Cynthia H. Milligan | 11,305 | 14,248 | (12) | * | ||||||
| Daniel A. Rykhus | 197,223 | (5) | * | |||||||
| Stephanie Herseth Sandlin | — | * | ||||||||
| Anthony D. Schmidt | 29,802 | (6) | * | |||||||
| Lon E. Stroschein | 23,100 | (7) | * | |||||||
T. Rowe Price Associates, Inc. 100 E. Pratt Street Baltimore, MD 21202 | 4,748,800 | (8) | 13.1 | |||||||
Neuberger Berman Group LLC 605 Third Avenue New York, NY 10158 | 4,331,533 | (9) | 11.9 | |||||||
The Vanguard Group, Inc. 100 Vanguard Blvd Malvern, PA 19335 | 2,164,282 | (10) | 6.0 | |||||||
BlackRock, Inc. 40 East 52nd Street New York, NY 10022 | 1,945,903 | (11) | 5.4 | |||||||
All executive officers, directors and nominees as a group (14 persons) | 768,581 | (12,13) | 2.1 | |||||||
| * Less than 1% | ||||||||||
| Name of beneficial owner | Stock units Vested | Shares beneficially owned | Percent of class | ||||
| David R. Bair | 35,258 | (1) | * | ||||
| Anthony W. Bour | 6,554 | 55,122 | (12,13) | * | |||
| Matthew T. Burkhart | 6,285 | (2) | * | ||||
| David A. Christensen | 3,338 | 379,256 | (3,12) | 2.1 | |||
| Thomas S. Everist | 3,338 | 12,200 | (12) | * | |||
| Mark E. Griffin | 3,338 | 98,980 | (4,12) | * | |||
| James D. Groninger | 24,786 | (5) | * | ||||
| Conrad J. Hoigaard | 3,338 | 75,000 | (12) | * | |||
| Thomas Iacarella | 125,303 | (6) | * | ||||
| Kevin T. Kirby | 2,611 | 10,000 | (12) | * | |||
| Marc E. LeBaron | - | 1,000 | * | ||||
| Cynthia H. Milligan | 4,576 | 6,124 | (12) | * | |||
| Barbara K. Ohme | 34,354 | (7) | * | ||||
| Daniel A. Rykhus | 56,513 | (8) | * | ||||
| Lon E. Stroschein | 1,300 | (9) | * | ||||
T. Rowe Price Associates, Inc. 100 E. Pratt Street Baltimore, MD 21202 | 2,377,700 | (10) | 13.2 | ||||
Neuberger Berman Group LLC 605 Third Avenue New York, NY 10158 | 2,327,717 | (11) | 12.9 | ||||
All executive officers, directors and nominees as a group (15 persons) | 921,481 | (12,14) | 5.1 |
(1) (2)Includes 4,338 shares that may be purchased within 60 days by exercise of outstanding options.
47,702 shares held in irrevocable trusts for the benefit of his adult children. Mr. Bour is a co-trustee of the Children’sChildren's Trusts.
(2) (14)Includes 63,61632,821 shares that may be purchased within 60 days by exercise of outstanding options. Also includes 183,354
(3) Includes 52,225 shares that may be purchased within 60 days by exercise of outstanding options.
(4) Includes 5,000 shares that may be purchased within 60 days by exercise of outstanding options.
(5) Includes 103,700 shares that may be purchased within 60 days by exercise of outstanding options.
(6) Includes 16,800 shares that may be purchased within 60 days by exercise of outstanding options.
(7) Includes 20,728 shares that may be purchased within 60 days by exercise of outstanding options.
(8) Data based on Schedule 13G filed by the shareholder with the SEC on February 8, 2013.
(9) Data based on Schedule 13G filed by the shareholder with the SEC on February 14, 2013.
(10) Data based on Schedule 13G filed by the shareholder with the SEC on February 11, 2013.
(11) Data based on Schedule 13G filed by the shareholder with the SEC on February 11, 2013.
(12) Does not include non-voting vested Stock Units held by spousesthe Deferred Compensation Plan for Directors.
(13) Includes 231,274 shares that may be purchased within 60 days by exercise of officers and directors, as to which beneficial ownership is disclaimed.outstanding options.
ELECTION OF DIRECTORS
2Proposal No. 1
Director Nominees and Qualifications. Seven directors are to be elected at the Meeting, each director to serve until the next Annual Meeting of Shareholders. Mr. Christensen and Mr. Hoigaard are retiring from the Board on May 24, 2011. All of the nominees listed below (except Mr. LeBaron)Andringa) are now serving as directors and all of the nominees have agreed to serve.
The following paragraphs provide information as of the date of this proxy statement about each nominee. The information presented includes information each director has given us about his or her age, all positions he or she holds within the Company, his or her principal occupation and business experience for the past five years, the names of other publicly-held companies of which he or she currently serves as a director or has served as a director during the past five years, and whether each director is independent. Independence has been determined according to Nasdaq listing standards.
As described below under “Corporate Governance –- Nominations to the Board of Directors”,Directors," in considering nominations to the Board of Directors, the Governance Committee of the Board considers such qualities as the individual’sindividual's experience, character, integrity and other factors. As a whole, the Board believes the current Board is composed of directors who bring diverse experiences and backgrounds relevant to the Company’sCompany's business; who form a balanced core of business executives with varied expertise; who have substantial experience outside the business community, and who will represent the balanced, best interests of the shareholders as a whole. We also believe that all of our director nominees have a reputation for integrity, honesty and adherence to high ethical standards. They each have demonstrated business acumen and an ability to exercise sound judgment, as well as a commitment of service to our Company and our Board. Each nominee’snominee's description below includes information regarding each nominee’snominee's specific experience, qualifications, attributes and skills that led our Board to the conclusion that he or she should serve as a director.
Name of Nominee (Age) Director Since Director Independence | Principal Occupation, Business Experience and Directorships in Public Companies in Past Five Years, and Qualifications to Serve as a Director of Raven | ||
Independent Director | Mr. | ||
Thomas S. Everist 1996 Independent Director | Mr. Everist was named Chairman of the Board of the Company on April 1, 2009. He is President and Chief Executive Officer of The Everist Company, Sioux Falls, | ||
4
Name of Nominee (Age) Director Since Director Independence | Principal Occupation, Business Experience and Directorships in Public Companies in Past Five Years, and Qualifications to Serve as a Director of Raven | |
Mark E. Griffin 1987 Independent Director | Mr. Griffin has been President and Chief Executive Officer of Lewis Drugs, Inc., Sioux Falls, SD since 1986. Lewis Drugs is a regional retail department and drug store chain. He is a board member of the National Association of Chain Drug Stores. He is also President and Chief Executive Officer of Griffson Realty Company, Fredin Associates and G.E.F. Associates, Sioux Falls, SD. Mr. Griffin brings over 20 years of experience as a CEO of a significant retail business and a real estate company, among other businesses, in the | |
Kevin T. Kirby 2007 Independent Director | Mr. Kirby | ||
Marc E. LeBaron Independent Director | Mr. LeBaron has been Chairman/CEO of Lincoln Industries in Lincoln, NE since 2001. Lincoln Industries is a supplier of products requiring high performance metal finishing. He has served on the Board of Directors of Ballantyne Strong, Inc. since 2005. He serves on | ||
Cynthia H. Milligan 2001 Independent Director | Mrs. Milligan is Dean Emeritus of the College of Business Administration University of Nebraska-Lincoln. She was Dean from 1998 until her retirement in 2009. She has been an adjunct professor at Georgetown University Law | ||
Daniel A. Rykhus 2008 Not Independent | Mr. Rykhus was named President and Chief Executive Officer on August 20, 2010 and had been Executive Vice President of the Company since 2004. He was the General Manager of the Applied Technology Division from 1998 through 2009, growing the |
All shares represented by proxies will be voted FOR all the previously named nominees unless a contrary choice is specified. If any director nominee should withdraw or become unavailable to serve for reasons not presently known, the proxies that would otherwise have been voted for such nominee will be voted for a substitute nominee that may be selected by the Governance Committee of the Board of Directors.
THE BOARD OF DIRECTORS UNANIMOUSLY RECOMMENDS THAT YOU VOTE UFORU ALL NOMINEES.
ADVISORY VOTE ONTO APPROVE EXECUTIVE COMPENSATION (SAY ON PAY)
Proposal No. 2
The Company’sCompany's executive compensation program is designed to align the interests of the executive team with those of Raven shareholders. The planBoard believes this alignment is demonstrated by the Company's excellent financial results in recent periods. “Compensation Discussion and Analysis” that begins on page 12, explains our compensation programs in more detail. In summary, the shareholders should approve our executive compensation for the following reasons, among others:
Our executive compensation program uses salary and benefits, a management incentive program and stock optionsa long-term incentive plan to achieve theseour goals, with a focus on tying compensation to corporate performance. Raven’sperformance while remaining competitive to retain and attract an outstanding management team.
In fiscal 2013, we worked with an independent compensation consultant to evaluate our compensation relative to our peers and to modify our long-term incentive compensation program to incorporate performance-based restricted stock units, tying compensation more closely to corporate performance that enhances shareholder value.
Raven's record financial performance and strong growth this year matches well with the changes in executive pay. When Raven had a weak yearlower results in fiscal 2010, executive compensation was sharply lower. lower than in earlier and subsequent years.
Raven shareholders have seen, over the past five years, a $100 investment grow to $174.50,$201.51 compared to $124.67$152.92 for the S&P 1500 Industrial Machinery or $114.00$135.81 for the Russell 2000 indexes. The
Our company has managed the transition to a new CEO with no significant disruption. The Compensation and Discussion Analysis that begins on page 13, explains our compensation programs in more detail.
At the annual meeting, the shareholders will be given the opportunity to vote for or against a non-binding resolution to approve the compensation of the named executive officers of the Company, as described in the Compensation Discussion and Analysis and the tabular and narrative disclosure regarding executive compensation contained in this proxy statement pursuant to the compensation disclosure rules of the Securities and Exchange Commission. For the reasons described above, the Board recommends that shareholders vote to approve the executive compensation of the Company.
Because the vote is advisory, it will not be binding upon the Board. However, the Personnel and Compensation Committee will take into account the outcome of the vote when considering future executive compensation arrangements.
THE BOARD OF DIRECTORS UNANIMOUSLY RECOMMENDS THAT YOU VOTE UFORU Proposal No. 2.
Proposal No. 43
The Audit Committee of the Board of Directors has selected PricewaterhouseCoopers LLP to serve as the Company’sCompany's independent registered public accounting firm for the fiscal year ending January 31, 2012.2014. While it is not required to do so, our Board is submitting the selection of PricewaterhouseCoopers LLP for ratification in order to ascertain the views of our shareholders with respect to the choice of audit firm. If the selection is not ratified, the Audit Committee will reconsider its selection. Representatives of PricewaterhouseCoopers LLP are not expected to be at the Annual Meeting.
THE BOARD OF DIRECTORS UNANIMOUSLY RECOMMENDS THAT YOU VOTE UFORU Proposal No. 4.3.
BOARD OF DIRECTORS AND COMMITTEES
The Board of Directors held four regular quarterly meetings, and one special meeting during the last fiscal year. The Company has an Audit Committee, Personnel and Compensation Committee and a Governance Committee. All directors attended at least 75 percent of their Board and Committee meetings.
6
| Governance Committee. | |
| Members: | Cynthia H. Milligan (Chair) Anthony W. Bour Thomas S. Everist Mark E. Griffin Kevin T. Kirby Marc E. LeBaron |
| Independence: | All of the Committee members meet the independence requirements of Nasdaq listing standards. |
| Responsibilities: | The Governance Committee reviews corporate governance standards and nominates candidates for the Board of Directors. It met |
| Charter: | The Charter is available on |
| Audit Committee. | |
| Members: | Kevin T. Kirby (Chair) Anthony W. Bour Cynthia H. Milligan |
Independence and Financial Expertise: | The Board has determined that each member of this Committee meets the requirements to be named “audit committee financial experts” as defined by the SEC rules implementing Section 407 of the Sarbanes-Oxley Act of 2002. The Committee members also meet the independence requirements of Nasdaq listing standards and the independence standards under Rule 10A-3 under the Securities Exchange Act of 1934. |
| Responsibilities: | The Audit Committee monitors the |
| Charter: | The charter is available on |
| Personnel and Compensation Committee. | |
| Members: | Mark E. Griffin (Chair) Thomas S. Everist |
Independence, Insiders and Interlocks: | All of the Committee members meet the independence requirements of Nasdaq listing standards. |
| Responsibilities: | The Committee reviews the |
| Charter: | The charter is available on |
4CORPORATE GOVERNANCE
Leadership Structure. Raven has kept the CEO and Chairman positions separate since 1961. The duties of the Chairman of the Board include collaborating with the CEO to establish an agenda for Board and Shareholder meetings, chairing the meetings, and calling executive sessions, as needed. The Chairman, along with the Governance Committee, leads the
7
establishment of governance standards. The Chairman also helps facilitate communication among Board members and with Raven management.
The Board does not have a firm policy as to whether the position of the Chair and the position of the CEO should be separate and intends to preserve the freedom to decide what is in the best interests of the company at any point of time. However, the Board does strongly endorse the concept of one of the outside directors being in a position of leadership for the rest of the outside directors.
Nominations to the Board of Directors. The Governance Committee of the Board of Directors seeks to recruit highly skilled and participative candidates who have the ability to strengthen the Board of Directors. The Governance Committee will consider timely presented nominations from shareholders if candidates are qualified.
Current directors whose performance, capabilities and experience meet the Company’sCompany's expectations and needs are typically nominated for reelection. In accordance with Raven’s Corporate Governance Standards,Raven's Nominations Policy dated August 28, 2012, directors are not re-nominated after they reach their 75th72nd birthday.
Recognizing that the contribution of the Board will depend on not only the character and capabilities of the directors taken individually but also on their collective strengths, the Board should be composed of:
| Ÿ | Directors chosen with a view toward bringing to the Board diverse experiences and backgrounds relevant to the | ||
| Directors who will form a balanced core of business executives with varied expertise; | |||
| Directors who have substantial experience outside the business community | |||
| Directors who will represent the balanced, best interests of the shareholders as a whole rather than special interest groups or constituencies. | |||
In considering possible candidates for election as a director, the Governance Committee should beis guided in general by the composition guidelines established above and, in particular, by the following:
| Each director should be an individual of the highest character and integrity and have an inquiring mind, vision and the ability to work well with others and exercise good judgment; | |||
Each director should be free of any conflict of interest which would violate any applicable law or regulation or interfere with the proper performance of the responsibilities of a director; | |||
| Ÿ | Each director should possess substantial and significant experience which would be of particular importance to the Company in the performance of the duties of a director; | ||
| Ÿ | Each director should have sufficient time available to devote to the affairs of the Company in order to carry out the responsibilities of a director; and | ||
| Each director should have the capacity and desire to represent the balanced, best interests of the shareholders as a whole. | |||
Consistent with the Company’s bylaws,Company's Bylaws, and the Governance Committee Charter, the Governance Committee will review and consider for nomination any candidate for membership to the Board recommended by a shareholder of the Company, in accordance with the evaluation criteria and selection process described in Proposal No. 1.above. Shareholders wishing to recommend a candidate to the Governance Committee for consideration in connection with an election at a specific annual meeting should notify the Governance Committee well in advance of the meeting date to allow adequate time for the review process and preparation of the proxy statement, and in no event later than the first day of February. Also, shareholders may submit director nominations to bring before the 2014 annual meeting by complying with the advance notice procedures contained in the Company's Amended Bylaws. To submit a timely director nomination for the 2014 annual meeting, see the timing requirements described under the
8
heading “Other Matters - Procedures for Submitting Shareholder Proposals - Proposals or Director Nominations not Included in the Proxy Statement.”
Risk Oversight. The Board provides oversight as to how management runs the business, including management’smanagement's approach to risk tolerance and risk management. Management is directly responsible for risk management. The Board considers risk management matters in its deliberations on various matters and has delegated aspects of its risk oversight role to certain committees. The Audit Committee considers risk when evaluating the integrity of Raven’sRaven's financial statements. The role of the audit process and internal control systems in monitoring and controlling risk areis also reviewed by the Audit Committee. The Personnel and Compensation Committee evaluates performance of the CEO, including risk tolerance and “tone at the top”.top." This Committee also considers the structure of the Company’sCompany's compensation plans and how they might affect risk tolerance. The Governance Committee considers risk when determining the Board leadership structure, nominating Directors and evaluating Board performance. These Committees, which all consist solely of independent Directors, are empowered to perform independent investigations of Corporatecorporate matters, should the need arise. The full Board reviews legal matters, credit risks, and insurance coverage at least annually with management. The Board also considers the risk implications of Raven’sRaven's business strategies, including its acquisition strategy, along with its execution of those strategies, as the Board monitors overall Company performance.
Code of Ethics. The Board of Directors, through its Governance Committee, has adopted a Code of Conduct that applies to directors, officers and all employees of the Company. The Code of Conduct is available on Raven’sRaven's website at www.ravenind.com.
Certain Relationships and Related Transactions. Mrs. Milligan is on the Board of Directors of Wells Fargo and Co., the parent company of Wells Fargo Bank, N.A., which provides transfer agent and registrar services, and borrowings to the Company under a line of credit. The terms of the services and credit line were considered by management competitive with other resources generally available to the Company. There wereno borrowings under the credit line in fiscal 2011.2013. As of April 5, 2011,4, 2013, Raven has no borrowings, and $1.3had $1.0 million of letters of credit and no other amounts outstanding under the line of credit.
Raven has adopted a written policy governing related party transactions. Under this policy, before effecting or continuing any “related party transaction,” the Audit Committee of the Board must first ratify or approve of the transaction and conclude that the transaction is on terms comparable to those that the Company could reasonably expect in an arm’sarm's length transaction with an unrelated third party. Under the policy, a “related party transaction” is any transaction with a related party other than one generally available to all Company employees or involving an amount less than $25,000. A “related party” is (i) a senior officer or a director, including members of their immediate family, (ii) a holder of more than 5% of our common stock, or (iii) an entity owned or controlled by the persons described in clauses (i) or (ii). The policy is available on Raven’sRaven's website at Hwww.ravenind.comH. The Company’sCompany's relationship with Wells Fargo is reviewed annually under this policy.
Board Diversity. The Board recognizes that diverse backgrounds and experiences are helpful to its deliberations and includes these attributes in its nominations policy outlined in “Corporate Governance –- Nominations to the Board of Directors” above. The Governance Committee seeks candidates for the Board who will represent the balanced, best interests of the shareholders as a whole rather than special interest groups or constituencies. Raven does not have a formal Board Diversitydiversity policy.
Communications with the Board of Directors. The Board of Directors believes that the most efficient means for shareholders and other interested parties to raise issues and questions and to get a response is to direct such communications to the Company through the office of the Secretary of the Company. Other methods are also described in the Investor Relations section of the Company's website, Hwww.ravenind.comH.
If, notwithstanding these methods, a shareholder or other interested party wishes to direct a communication specifically to the Board of Directors, a letter to the Board is the most appropriate method. To insure that the communication is properly directed in a timely manner, it should be clearly identified as intended for the Board:
Raven Industries, Inc.
Attention: Board Communications –- (Director Name if applicable)
P.O. Box 5107
Sioux Falls, SD 57117-5107
9
The Corporate Secretary's Office will collect and organize all such communications. A summary of communications received will be periodically provided to the Company’sCompany's Governance Committee, who will make the final determination regarding the disposition of any such communication.
The Board believes that the Company should speak with one voice and has empowered management to speak on the Company's behalf subject to the Board's oversight and guidance on specific issues. Therefore, in most circumstances the Board will not respond directly to inquiries received in this manner but may take relevant ideas, concerns and positions into consideration.
10
NON-MANAGEMENT DIRECTOR COMPENSATION
During fiscal 2010,2013, directors who were not full-time employees of the Company were paid a retainer fee of $20,000$30,000 plus $1,200$1,500 for each regular board meeting and $600$800 for each telephonic or committee meeting. The Chairman of the Board received $1,200 per month in lieu of meeting fees. The Audit Committee Chair received $2,000 annually for quarterly audit updates and other duties.
Directors received a Stock Unit Award under the Deferred Compensation Plan for Directors of Raven Industries, Inc. (the “Deferred"Deferred Stock Plan”Plan") approved by the shareholders on May 23, 2006. Directors receive an automatica grant of Stock Units every year in an amount equal to the amount of the cash retainer$30,000 divided by the closing stock price on the date of the annual meeting. Retainers may also be deferred under this plan. Under the Deferred Stock Plan, amounts are deferred until retirement, or a later date upon the election of the director. Deferred payouts under the Deferred Stock Plan are paid in Raven common stock.
| Name | Fees Earned or Paid in Cash (1) ($) | Stock Awards (2) ($) | All Other Compensation (3) ($) | Total ($) | ||||||||||||||
| Thomas S. Everist | 34,400 | 20,000 | - | 54,400 | ||||||||||||||
| Anthony W. Bour | 30,400 | 20,000 | - | 50,400 | ||||||||||||||
| David A. Christensen | 29,000 | 20,000 | - | 49,000 | ||||||||||||||
| Mark E. Griffin | 29,000 | 20,000 | - | 49,000 | ||||||||||||||
| Conrad J. Hoigaard | 29,000 | 20,000 | - | 49,000 | ||||||||||||||
| Kevin T. Kirby | 30,200 | 20,000 | - | 50,200 | ||||||||||||||
| Cynthia H. Milligan | 28,400 | 20,000 | - | 48,400 | ||||||||||||||
| Director Compensation Table | ||||||||
| Name | Fees Earned or Paid in Cash(1) | Stock Awards(2) | All Other Compensation(3) | Total | ||||
| ($) | ($) | ($) | ($) | |||||
| Thomas S. Everist | 44,400 | 30,000 | — | 74,400 | ||||
| Anthony W. Bour | 42,700 | 30,000 | — | 72,700 | ||||
| Mark E. Griffin | 41,500 | 30,000 | — | 71,500 | ||||
| Marc E. LeBaron | 41,500 | 30,000 | — | 71,500 | ||||
| Kevin T. Kirby | 42,300 | 30,000 | — | 72,300 | ||||
| Cynthia H. Milligan | 39,200 | 30,000 | — | 69,200 | ||||
(1) Mr. Bour and Mr. LeBaron deferred $30,000 of their retainers into Stock Units under the Deferred Stock Plan. | ||||||||
(2) Represents 909.78 fully vested Stock Units valued at $32.975 per Unit, the price of Raven common shares on the date of the Award, May 22, 2012. | ||||||||
(3) Does not include perquisites and benefits, which totaled less than $10,000 for each director. | ||||||||
11
EXECUTIVE COMPENSATION
COMPENSATION DISCUSSION AND ANALYSIS
Overview
The compensation program is designed to align the interests of the executive team with those of Raven shareholders. The plan uses salary and benefits, a management incentive program and stock optionslong-term equity incentives to achieve these goals, with a focus on tying compensation to corporate performance. Retention of top talent and achievement of corporate objectives measure the effectiveness of our compensation plan.
Raven also uses non-compensatory programs, such as annual performance reviews, employee development and education programs, and succession planning. We believe that these programs are more effective than compensation alone for optimizing talent utilization and executive development.
The consultant also recommended that long term incentive compensation be modified to strengthen the relationship between corporate financial objectives and compensation levels. In April 2012, the Committee, as recommended by the consultant, approved a long-term incentive plan ("LTIP") for executives and other key employees. The plan reduced the number of stock options and added performance based restricted stock units (RSUs) to the compensation package. The performance goals for the vesting of performance shares under the RSUs are closely tied to the creation of shareholder value.
Raven's financial performance for the year ended January 31, 20112013, included record sales and record net income,income. Although fiscal 2013 growth was below management's expectations, Raven delivered a 12.9% return on sales, 22.6%20.3% return on average assets and 30.4%29.1% return on beginning shareholders equity. Sales were up 32%6% and net income rose 42%. These4% from the levels in fiscal 2012. Fiscal 2012 results indicated the strengthwere very strong, with sales and profit growth in excess of Raven20% and strong returns on sales, assets and equity. We believe our historical investment in a year ofbusiness expansion, along with strong management, change. They came on the heels ofhas contributed to our strong performance in recent periods.
Raven's executive compensation levels have been closely tied to these company performance levels. For fiscal 2010 cash preservation and cost containment strategies that enabled management to reinvest across the company and return $34 million to shareholders while maintaining substantial liquidity and a strong capital base.
Other significant changes in compensation levels were related to the retirementpromotion of ourMr. Rykhus to President and Chief Executive Officer in August 2010 and the promotion of Raven’s Executive Vice Presidentneed to that position.increase executive compensation to a more competitive level as evidenced by internal and external comparisons.
12
Objectives of the Company’sCompany's Executive Compensation Program
Alignment with Shareholder Interests
Our compensation program is designed to motivate and reward Raven’sRaven's executives to achieve the short and long-term goals that we believe will enhance shareholder value. The short-term goals are embodied in our annual budget. Thesecompensation plans and include income targets, productivity goals,growth and efficient working capital utilization and expense control.utilization. The goals are set to be both challenging and achievable, so as to encourage reasonable risk taking and motivate performance. Building on these short-term objectives, the program also seeks to reward executives for enhancing shareholder value over the long-term. Raven’sRaven's long-term objectives include growing sales and net income and efficiently utilizing invested capital.
In order to strengthen the relationship between corporate financial objectives and compensation levels, and consistent with the advice of the independent consultant, in April 2012, the Committee approved the LTIP, with goals closely tied to the long-term creation of shareholder value.
Retention
Retention aspects of the program are designed to take advantage of the experience of Raven executives and avoid unwanted turnover in the executive team. The executive officers identified on the Summary Compensation Table on page 2019 (the “Named Executives”) average 1914 years experience with Raven. We believe that promotion from within and length of tenure at every level of the organization enhances productivity and reduces compensation cost.productivity.
Internal Equity and Competitiveness
Raven believes in internal equity and that having competitive compensation policies are critical to talent retention and recruiting. We reviewcompare executive pay to prevent it from being out of line when compared to the other key managers and employees, both inside Raven and externally. We recognize the risk of not being able to recruit top talent or losing top talent to competitors or others with higher compensation levels. Raven’sAddressing this risk has been challenging, and the gap between Raven and its peer group continues, as shown by the findings of the benchmarking study by the compensation consultant. Raven's growth strategy and compensation philosophy will be difficult to sustain if management turnover is high and we are required to recruit from outside Raven to fill key positions. Therefore, the Committee has undertaken to increase executive compensation over time to reach median levels. For example, the targeted compensation under the LTIP is higher than under the previous long term incentive package consisting solely of stock options.
Role of Management, the Personnel and Compensation Committee and Consultants
In December 2011, the Committee retained The Delves Group ("Delves") to conduct a competitive compensation analysis of Raven's top nine executives, including the Named Executives. The consultant's report was delivered to the Committee in March 2012.
Subsequent to the report from Delves, Raven's Board of Directors asked for an analysis of board of directors compensation and a review of the Committee's charter. Delves did not provide any consulting services to Raven management.
Our President and Chief Executive Officer recommends executive compensation to the Personnel and Compensation Committee (the “Committee”) for approval annually. He used the information in the Delves report to provide additional perspective to his recommendations. Management's role also included providing information to Delves regarding the strategic direction of the company, its performance goals and perspective on executive compensation objectives and competitiveness. Management also updates peer group information at the request of the Committee.
The Committee approves executive salaries, benefits and stock optionLTIP grants. The Committee’sCommittee's decisions regarding the compensation of our President and Chief Executive Officer are made in executive session. Management and the Committee do not use compensation consultants because we believe the benchmarking information developed internally gives the Committee sufficient information to make compensation decisions.
Benchmarking
Delves used data from three sources for comparison to Raven’s executive compensation:
The 2011 General Industry Executive compensation historically was driven by taking the compensation levels for non-executive employees and extrapolating to key employees and ultimately the executive teamCompensation Survey
The 2011 High Technology Executive Compensation Survey
Proxy statements from a peer group of 18 companies
In fiscal 2012, management and the Named Executives. In preparation for the transition toCommittee developed a new Chief Executive Officer that occurred in August 2010, the Committee and the Former Chief Executive began a process of looking outside Raven for additional input into these decisions. During fiscal 2011, the Committee undertook a benchmarking process which examined the compensation levels at 15 industrial and technology companies, including Raven. This peer group, consists of industrialfocusing on companies with size and technology companies, mainly ofindustry comparable size to RavenRaven. Management's initial list was reviewed by Delves for relevance and mainly located in the Midwest.several adjustments were made to better align
13
industry groups. The peer group is listed below. The Committee believes that these 18 companies are an appropriate peer group for comparison, as well as a group that is large and diverse enough so that any one company does not alter the overall analysis. Raven's size was near the peer group median, while returns on assets, equity and invested capital were the highest in the peer group.
The survey data was updated to January 1, 2012, using the peer companies' most recently released proxy statements.
The results of the competitive analysis indicated that reportedpresented to the Committee in March 2012 showed a significant shortfall in total compensation, forwhen compared to the Former Chief Executive Officer placed 10th in this group. Results forpeer group median levels and other survey data. Therefore, the CFO were similar. Salary surveys were used to help confirm these results for other executives. Raven has tried to maintain compensation in the middle of the relevant range for positions and intends to continue this practice. Therefore, based on the additional information gathered in the review, RavenCommittee anticipates itsthat Raven's executive compensation, of the new CEOincluding base salary and other executivesincentive compensation, will rise over an extended period at a faster rate than industry averages in order to reach median levels.averages.
The peer group approved by the Compensation Committee is identifiedlisted below:
($In millions) | |||||||||
| Company Name | Revenue* | ||||||||
| AeroVironment, Inc. | 325.0 | ||||||||
| American Science and Engineering, Inc. | 203.6 | ||||||||
| Astronics Corporation | 266.4 | ||||||||
| API Technologies, Inc. | 280.8 | ||||||||
| Badger Meter Inc. | 319.7 | ||||||||
| Cognex Corporation | 324.3 | ||||||||
| Daktronics, Inc. | 489.5 | ||||||||
| FEI, Co. | 891.7 | ||||||||
| Franklin Electric Co. | 891.3 | ||||||||
| HEICO Corporation | 897.3 | ||||||||
| II-VI, Inc. | 534.6 | ||||||||
| Kaydon Corporation | 475.2 | ||||||||
| Lindsay Corp. | 551.3 | ||||||||
| Micrel, Inc. | 250.1 | ||||||||
| MTS Systems Corp. | 542.3 | ||||||||
| Rogers Corp. | 498.8 | ||||||||
| STR Holdings | 95.3 | ||||||||
Base Salary
Salaries for the Named Executives are based on the scope of their responsibilities, performance, experience and potential. The salaries of their peers and subordinates inside and outside the Company were considered when setting salary levels. The primary objectives addressed by base salary in the Compensation Program are to retain and attract qualified and experienced executives into these positions. The base salary indicates the basic level of compensation commitment that Raven has to each of the Named Executives and their positions in the Company.
Management has observed that over the past few years, as it has had to recruit for management and executive talent on a nationwide basis, the Raven salary scale is becoming compressed. Executive salaries at Raven appear to have fallen behind national competition. Our peer group analysis confirms this. Salaries for all of the Named Executives were increased in the fiscal year ended January 31, 20112013 (fiscal 2011)2013) over fiscal 20102012 levels and 2011 levels. While the Committee has not committed to future salary adjustments and believes that increasing at risk compensation, such as management incentives and stock options and performance-based awards under the new LTIP, will mitigate this issue, it will continue to closely monitor thisthe situation.
14
The salary increases for the individual Named Executives are discussed under “Executive Compensation for the Named Executives” below.
Management Incentive Plan
The management incentive plan is intended to pay the Named Executives when they achieve the annual financialgrowth objectives of their operations, which are established before the beginning of the fiscal year through the budget process.operations. Incentive paymentspayment maximums for the named executives range from 5080% to 70%120% of annual base salary, which is designed to put a sizable portion of the Named Executives’Executives' cash income at risk if annual objectives are not achieved.
Incentive payments are based on formulas defined and documented at the beginning of Raven’sRaven's fiscal year. Income based formulas are usually setin fiscal 2013 were targeted so that if budgeted results areapproximately 10% income growth was achieved, the income based incentive would pay about 60%65% of maximum payout levels. In fiscal 2011, this guidelinePayments would be 17% of maximum if income was used. However, in fiscal 2010 because lower results were expected,flat and would be zero if income declined by 20% or more. Maximum payouts would occur at budgeted levels were generally a lower percentage of the maximum payout.23% income growth. The Committee approves the incentive payments, which are usually paid in March of each year. The ranges are intended to be challenging yet achievable, with the maximum level intended to be difficult to achieve. Fiscal 2012 incentives maximized at lower payout levels (65-100% for the executives) and at lower (17%) earnings growth. In fiscal 2011 and prior, the targeted payouts were at 60% of maximum, based on budgetary targets. The table included in footnote (6)6 to the Summary Compensation Table shows the level of payouts based on the various objectives for the past three fiscal years. None
For fiscal 2013, incentive payments for the Chief Executive Officer and the Chief Financial Officer were based on achieving net income targets. Income based incentives were set to begin when net income exceeded $40,500,000 and, for Mr. Rykhus, were designed toresult in a payment of 78% of base salary at the targeted level of net income of $55,600,000 and the maximum incentive payment of 120% of his base salary if Raven achieved the high end of the income range ($62,200,000 in net income for fiscal 2013). Mr. Iacarella's incentive was based on criteria similar to Mr. Rykhus, with 51% of base salary payable at the targeted level of $55,600,000 of net income and the maximum incentive payment of 80% of his base salary if Raven achieved $62,200,000 in net income.
The other Named Executives receivedwere responsible for specific business units. Their incentives for fiscal 2013 were based on achieving growth objectives for their respective operating units and the corporation. Operating unit objectives included levels of operating income net of a totalcharge for working capital utilization. Messrs. Burkhart, Schmidt and Stroschein, as Divisional Vice Presidents, could have had a maximum payout of 60% of the maximum in all three years. Looking forward, inbase salary for fiscal 2012 the2013 based on divisional results and 20% of base salary based on company-wide net income. The details of these incentive plans will focus onand the actual growth rather than budgeted targets, with 90% ofpayouts are described under “Executive Compensation for Fiscal 2013 for the incentive maximums being paid for achieving income growth of 12%. The Committee believes this will better tie pay to actual performance levels of the company, improve the Company’s budgeting process and avoid payouts during down years.Named Executives” below.
Stock Options and Performance-Based Restricted Stock AwardsUnits
In March 2012, Delves presented recommendations to modify Raven's compensation program by reducing the number of stock options being granted annually and adding other components of an annual long-term incentive plan. Based on these recommendations, in April 2012 the Committee adopted the LTIP. The Committee approved grants to our executives of performance-based RSUs that vest after three years based on the achievement of three-year targets for return on sales, to be granted along with the executive's annual stock option grants. Based on Delves' recommendations, LTIP levels for the executives are equally split between options and performance based RSUs. At the end of the three-year RSU vesting period, if at least the minimum level is reached for the three-year performance goals, the shares received under the awards will vary from 50-150% of the targeted level depending on the level of performance achieved. Implementation of the LTIP increased targeted executive compensation by approximately 7-10%, because the impact of the three-year plan was not fully offset by the reduction in stock options. The inclusion of the performance based RSUs in the LTIP has increased the percentage of the executives' compensation that is variable based on long-term performance.
Management and the Committee believe the addition of these performance-based incentives will further align executive compensation with the company's objectives by using the three-year long-term incentive plan to help sustain Raven's strong return on sales over the long term, while the annual incentive plan remains based on the company's short-term income growth and the stock options continue to tie an element of compensation to actual shareholder returns. The LTIP is also expected to improve the competitive level of executive pay at Raven because the LTIP targets compensation at the 60th percentile of incentive compensation for the market consensus. The issuance of shares required to execute this plan was approved by the shareholders on May 22, 2012.
Stock options and awards of company shares are designed to promote the alignment of long-term interests between an executive and Raven shareholders as well as to assist in the retention of executives and key employees. The ultimate value to the executives is directly tied to the value of Raven common shares. The regular option grants are made annually, at the fourth quarter Committee meeting, vest in equal installments over four years and
15
expire in five years. The Committee and management believe that the policy of granting options annually, along with the relatively short life of the options, helps prevent option holders from benefiting from long-term increases in the stock market and more effectively ties their compensation to Raven’sRaven's success. The shorter life also reduces option expense recorded on the income statement. The Committee has never reset an option price.
Stock Retention Policy for Executives
Raven has a policy requiring executives to retain 50% of the “net profit shares” obtained via stock option or award. Our executives are strongly encouraged not to sell shares other than when paying taxes on option exercises. Executives have historically retained a substantial portion of their shares. The shares owned by the executive officers of the Company are listed on page 2 of this proxy statement under the caption “Ownership of Common Stock.”
All Other Compensation
We provide other benefits to executives, which we believe to be reasonable, competitive and consistent with the overall compensation program. Raven considers these items in conjunction with base salary in meeting the objectives of retaining and attracting qualified and experienced executives. These items are detailed in footnote 7 to the Summary Compensation Table. The 401(k) and profit sharing benefits are essentially the same as all other Raven employees receive. Life insurance benefits to the Former Chief Executive Officer and the Chief Financial Officer reflect the Company’s continuing commitment under an estate planning program we no longer make available to new executives. The Former Chief Executive Officer had use of a Company provided automobile. Raven also provides supplemental health and wellness benefits available to its executives to encourage a healthy lifestyle. To the extent insurance and health benefits are subject to income taxes, executives are reimbursed for this additional tax.
Post-termination Compensation and Benefits
Raven has employment agreements with each Named Executive, which provides for a 30-day notice period before termination and outlines the employment benefits discussed under “All Other Compensation” above and retirement benefits. The purpose of the benefits is to attract and retain seasoned executives, rewarding their long-term commitment to Raven. Retirement benefits, available when the sum of the employee’semployee's age and years of service exceeds 80, represent a continuation of the health and insurance benefits outlined in “All Other Compensation” above.
Raven uses dual-trigger “Change in Control” severance agreements to protect it from the loss of executive talent during a Change in Control. Upon a change in control, positions held by the Named Executives may be at risk. By providing a cash benefit of one or two times salary and incentive payments if executives are terminated, the Committee believes that, in the event of a Change in Control, the agreements would maintain stability within its executive group during what could be a potentially turbulent time. See “Potential Payments on Termination or Change in Control.”
Executive Compensation for Fiscal 20112013 for the Named Executives
Chief Executive Officer
Mr. Rykhus was named Raven’sis Raven's President and Chief Executive officer as of August 20, 2010. Prior to that date he was our Executive Vice President.officer. His fiscal 20112013 total compensation of $1,226,862 reflected$1,498,885 was 2% higher than in fiscal 2012 due primarily to higher salary and LTIP levels, partially offset by lower incentive plan payments. Over the past three years, Mr. Rykhus' compensation has been affected by his promotion.promotion to Chief Executive. His salary increased from $207,500 in fiscal 2010 to $213,800 as of February 1, 2010, $325,000 as of August 20, 2010 and $400,000 as of April 1, 2011.2011, to $460,000 on February 1, 2012. His compensation also includes an additional grant of 25,000 stock options valued at $275,750 given in recognition of his promotion, which is not expected to be repeated. The significantly improved performance of the company increased Mr. Rykhus’ incentive payments from $20,750 last year to $162,804. In fiscal 2011, the Company achieved net income of $40.5 million against a budgeted $30.3 million and the top payout level of $32.0 million; therefore the payment for his income based incentive was maximized at $150,950. Inventory turn objectives were not achieved and expense control objectives were partially achieved. Total incentive payouts for fiscal 2011 of $162,804 were 61% of base salary. This payment was 92% of the maximum under his incentive plan. In fiscal 2010, he received a $20,750 payout based on Electronic System Division results. Overall, he received 17% of the maximum payment available under his management incentive plan in fiscal 2010. He received the maximum available income-based incentive in fiscal 2009 based on the outstanding performance by the Applied Technology Division, of which he was Division Manager in fiscal 2009. In fiscal 2012, his incentive plan maximum will increaseincreased from 100% of salary to 100%120% of his salary to be more consistent with CEOs at other companies. The weaker performance of the company reduced Mr. Rykhus' incentive payments from $387,500 in fiscal 2012 to $193,752 in fiscal 2013. Fiscal 2013 net income growth of 4% resulted in a payout of 42% of salary versus his maximum payout of 100% in fiscal 2012. His regularincrease in LTIP compensation as a result of the plan modifications was $139,971, compared to his fiscal 2012 stock option grant was 30,000 shares.grant.
Chief Financial Officer
Mr. Iacarella is our Chief Financial Officer. His total compensation of $525,839$663,029 increased by 67%4% in fiscal 20112013 due primarily to higher salary and LTIP levels, partially offset by lower incentive plan payments and increased stock option awards.payments. His objectives under the incentive plan were similaridentical to Mr. Rykhus’Rykhus'. Overall, heHis maximum payout under the plan increased from 65% to 80% of salary in fiscal 2013. He received 91% of the maximum payment available under his management incentive plan compared to 12% in fiscal 20102012 and 60%27% of salary in fiscal 2009.2013. His base
16
salary increased by 3%11%, whichreflecting the move to improve executive salaries discussed above (see “Base Salaries.”) His increase in LTIP compensation as a result of the plan modifications was slightly higher than the Company-wide rate of increase. He received a grant of 12,000$68,236, compared to his fiscal 2012 stock options.option grant.
Vice President Applied Technology Division
Mr. Burkhart headsleads the Applied Technology Division and has since February 1, 2009.Division. His total compensation increased by 79%22% due primarily to higher salary and LTIP levels along with higher incentive payments and stock options.plan payments. In fiscal 20112013, the Applied Technology Division reported $29.3$57.0 million of operating income after capital charges. The budget for20% increase combined with the division was $25.8 million, at which level he would have received4% corporate income increase to generate a $38,266 payout. He maximized his profit incentive at an $81,600 payout because operating income after capital charges was greater than theof 62% of salary. His maximum payout levelunder the plan increased from 65% to 80% of $27.8 million. Productivity improvement objectives were not achieved. Overall, he received 96% of the maximum payment available under his management incentive plan. He received an incentive payment of $8,250salary in fiscal 2010 because the division improved its inventory turns.2013. His base salary increased by 3%24%, whichreflecting the move to improve executive salaries discussed above (see “Base Salaries”.) His increase in LTIP compensation as a result of the plan modifications was slightly higher than the Company-wide rate of increase. He received a grant of 12,000$68,236, compared to his fiscal 2012 stock options.option grant.
Vice President Engineered Films Division
Mr. Groninger headsSchmidt has led the Engineered Films Division.Division since February 1, 2012. His total compensation increased by 82% dueof $578,200 was comparable to higher incentive payments and stock options.the other Division Vice Presidents. In fiscal 20112013 the Engineered Films Division reported $17.9$23.3 million of operating income after capital charges. The budget for17% increase combined with the 4% corporate income increase to generate a payout of 56% of salary. His maximum payout under the plan was 80% of salary in fiscal 2013. His LTIP award was comparable to the other division was $9.7 million, at which level he would have received a $17,535 payout. He maximized his profitVice Presidents.
Vice President Aerostar Division
Mr. Stroschein has led the Aerostar Division since October 1, 2010. His total compensation decreased by 4% due primarily to lower incentive at an $84,192 payout, becauseplan payments, partially offset by higher salary and LTIP levels. In fiscal 2013 the Aerostar Division reported significantly lower operating income after capital charges was greater thancharges. As a result, only the 4% corporate income increase generated an incentive payout of 6% of salary. His maximum payout levelunder the plan increased from 65% to 80% of $10.8 million. Productivity improvement objectives were also achieved. Overall, hesalary in fiscal 2013. He received the maximum payment available under his management incentive plan. He received no incentive paymentplan in fiscal 2010 or 2009 because the division recorded lower operating results and did not meet its other objectives under the plan.2012. His base salary increased by 3%20%, which was slightly higher thanreflecting the Company-wide rate of increase. He received a grant of 12,000 stock options.
option grant.
COMPENSATION COMMITTEE REPORT
The Personnel and Compensation Committee of the Company’sCompany's Board of Directors has reviewed and discussed the Compensation Discussion and Analysis and discussed that Analysis with management. Based on its review and discussion with management, the committee recommended to our Board of Directors that the Compensation Discussion and Analysis be included in the Company’sCompany's Annual Report on Form 10-K and the Company’s 2011 proxy statement.Company's 2013 Proxy Statement.
Submitted by the Personnel and Compensation Committee of the Company’sCompany's Board of Directors:
Mark E. Griffin David A. Christensen Thomas S. Everist Conrad J. Hoigaard Kevin T. KirbyMarc. E. LeBaron
17
EQUITY COMPENSATION PLAN INFORMATION
The following table presents the number of securities authorized for issuance under Raven’sRaven's equity compensation plans as of January 31, 2011.
| Equity Compensation Plan Information | |||
| Plan Category | Number of securities to be issued upon exercise of outstanding options, warrants and rights (a) | Weighted-average exercise price of outstanding options, warrants and rights (b) | Number of securities remaining available for future issuance under equity compensation plans (excluding securities reflected in column(a)) |
Equity compensation plans approved by security holders | 471,884 | $34.73 | 362,109 |
Equity compensation plans not approved by security holders | ---- | ---- | ---- |
| Total | 471,884 | $34.73 | 362,109 |
| Name and Principal Position | Fiscal Year | Salary ($) | Stock Awards ($) | Option Awards ($) | Non-equity Incentive Plan Compensation ($) | All Other Compensation ($) | Total ($) | |||||||||||||||||||
| (4) | (5) | (6) | (7) | |||||||||||||||||||||||
Daniel A. Rykhus (1) | 2011 | 264,767 | - | 771,260 | 162,804 | 28,031 | 1,226,862 | |||||||||||||||||||
| President and | 2010 | 207,500 | - | 99,290 | 20,750 | 29,591 | 357,131 | |||||||||||||||||||
| Chief Executive Officer | 2009 | 183,500 | - | 75,952 | 100,925 | 26,620 | 386,997 | |||||||||||||||||||
| Thomas Iacarella | 2011 | 194,400 | - | 198,204 | 105,754 | 27,481 | 525,839 | |||||||||||||||||||
| Vice President and | 2010 | 188,700 | - | 87,443 | 9,058 | 29,693 | 314,894 | |||||||||||||||||||
| Chief Financial Officer | 2009 | 185,000 | - | 75,952 | 66,067 | 28,746 | 355,765 | |||||||||||||||||||
| David R. Bair | 2011 | 172,300 | - | 132,136 | 82,704 | 21,733 | 408,873 | |||||||||||||||||||
| Division Vice President | 2010 | 167,300 | - | 67,698 | 71,939 | 21,087 | 328,024 | |||||||||||||||||||
| Electronic Systems Division | 2009 | 164,000 | - | 59,792 | - | 21,095 | 244,887 | |||||||||||||||||||
Matthew T. Burkhart (2) | 2011 | 170,000 | - | 198,204 | 81,600 | 23,264 | 473,068 | |||||||||||||||||||
| Division Vice President | 2010 | 165,000 | - | 73,904 | 8,250 | 17,664 | 264,818 | |||||||||||||||||||
| Applied Technology Division | ||||||||||||||||||||||||||
| James D. Groninger | 2011 | 175,400 | - | 198,204 | 87,700 | 25,309 | 486,613 | |||||||||||||||||||
| Division Vice President | 2010 | 170,300 | - | 75,596 | - | 22,152 | 268,048 | |||||||||||||||||||
| Engineered Films Division | 2009 | 167,000 | - | 67,064 | - | 21,741 | 255,805 | |||||||||||||||||||
Ronald M. Moquist (3) | 2011 | 262,950 | - | - | 221,480 | 56,410 | 540,840 | |||||||||||||||||||
| Former President and | 2010 | 331,500 | 144,240 | - | 15,912 | 36,042 | 527,694 | |||||||||||||||||||
| Chief Executive Officer | 2009 | 325,000 | 134,805 | - | 134,232 | 48,594 | 642,631 | |||||||||||||||||||
| (1) | Mr. Rykhus was named President and Chief Executive Officer on August 20, 2010, prior to that date he was Executive Vice President and during fiscal 2009 he was also the Division Manager of the Applied Technology Division. | |||||||||||||||||||||||||
| (2) | Mr. Burkhart was named General Manager of the Applied Technology Division on February 1, 2009 and Division Vice President on February 1, 2010. | |||||||||||||||||||||||||
| (3) | Mr. Moquist retired on August 20, 2010. Compensation in this table includes payments for vested vacation, incentives related to fiscal year 2011 performance and benefits paid through January 31, 2011. Retirement benefits for Mr. Moquist are described under "Potential Payments on Termination or Change in Control" on page 25. | |||||||||||||||||||||||||
| (4) | Mr. Moquist received a grant of 4,800 shares on December 4, 2009 and 5,500 shares of Company stock on December 5, 2008 in lieu of stock options. These shares were valued at the closing market price, $30.05 and $24.51, respectively. | |||||||||||||||||||||||||
| (5) | Amounts shown reflect the aggregate fair value of awards granted during the year. Assumptions used in the calculation of this amount are included in Note 11 on pages 41 and 42 of the Company's Annual Report on form 10-K. | |||||||||||||||||||||||||
| Name and Business Unit | Fiscal year | Income | Expense control | Inventory turns | Productivity improvements | Total non-equity incentive plan compensation | ||||||||||||||||
| Daniel A. Rykhus - Entire Company | 2011 | 150,950 | 11,854 | - | N/A | 162,804 | ||||||||||||||||
Divisional and Entire Company (a) | 2010 | 20,750 | N/A | N/A | N/A | 20,750 | ||||||||||||||||
| Applied Technology | 2009 | 91,750 | N/A | - | 9,175 | 100,925 | ||||||||||||||||
| Thomas Iacarella | 2011 | 97,200 | 8,554 | - | N/A | 105,754 | ||||||||||||||||
| Entire Company | 2010 | - | 9,058 | - | N/A | 9,058 | ||||||||||||||||
| 2009 | 54,967 | 11,100 | - | N/A | 66,067 | |||||||||||||||||
| David R. Bair | 2011 | 82,704 | N/A | N/A | - | 82,704 | ||||||||||||||||
| Electronic Systems | 2010 | 66,920 | N/A | - | 5,019 | 71,939 | ||||||||||||||||
| 2009 | - | N/A | - | - | - | |||||||||||||||||
| Matthew T. Burkhart | 2011 | 81,600 | N/A | N/A | - | 81,600 | ||||||||||||||||
| Applied Technology | 2010 | - | N/A | 8,250 | - | 8,250 | ||||||||||||||||
| James D. Groninger | 2011 | 84,192 | N/A | N/A | 3,508 | 87,700 | ||||||||||||||||
| Engineered Films | 2010 | - | N/A | - | - | - | ||||||||||||||||
| 2009 | - | N/A | - | N/A | - | |||||||||||||||||
| Ronald M. Moquist | 2011 | 203,000 | 18,480 | - | N/A | 221,480 | ||||||||||||||||
| Entire Company | 2010 | - | 15,912 | - | N/A | 15,912 | ||||||||||||||||
| 2009 | 116,682 | 17,550 | - | N/A | 134,232 | |||||||||||||||||
2013.
| Fiscal year | Retirement benefit and profit sharing plans (a) | Life insurance premiums | Supplemental health benefits (b) | Other fringe benefits (c) | Tax reimbursement on taxable fringe benefits | Total all other compensation | |||||||
| Name | |||||||||||||
| Daniel A. Rykhus | 2011 | 11,992 | 678 | 9,265 | 2,694 | 3,402 | 28,031 | ||||||
| 2010 | 10,135 | 451 | 12,908 | 1,000 | 5,097 | 29,591 | |||||||
| 2009 | 9,123 | 377 | 9,332 | 3,304 | 4,484 | 26,620 | |||||||
| Thomas Iacarella | 2011 | 9,747 | 5,627 | 5,813 | 2,454 | 3,840 | 27,481 | ||||||
| 2010 | 8,514 | 5,571 | 7,632 | 2,233 | 5,743 | 29,693 | |||||||
| 2009 | 7,240 | 4,295 | 5,687 | 6,107 | 5,417 | 28,746 | |||||||
| David R. Bair | 2011 | 11,500 | 871 | 6,613 | 1,000 | 1,749 | 21,733 | ||||||
| 2010 | 5,818 | 785 | 10,555 | 1,000 | 2,929 | 21,087 | |||||||
| 2009 | 5,404 | 761 | 9,399 | 1,900 | 3,631 | 21,095 | |||||||
| Matthew T. Burkhart | 2011 | 8,819 | 312 | 10,359 | 1,000 | 2,774 | 23,264 | ||||||
| 2010 | 7,005 | 267 | 8,021 | 1,000 | 1,371 | 17,664 | |||||||
| James D. Groninger | 2011 | 8,693 | 828 | 11,715 | 1,000 | 3,073 | 25,309 | ||||||
| 2010 | 5,919 | 801 | 11,448 | 1,000 | 2,984 | 22,152 | |||||||
| 2009 | 5,490 | 506 | 8,672 | 3,517 | 3,556 | 21,741 | |||||||
| Ronald M. Moquist | 2011 | 29,029 | - | 3,031 | 10,438 | 13,912 | 56,410 | ||||||
| 2010 | 15,522 | 1,680 | 3,109 | 14,641 | 1,090 | 36,042 | |||||||
| 2009 | 12,807 | 11,515 | 2,847 | 14,321 | 7,104 | 48,594 | |||||||
(a) Represents the safe-harbor base and matching contributions under the Company's 401(k) plan. This amount is either contributed to the plan or paid as additional salary depending on IRS limitations. Also includes cash payments under the Company's Profit Plus plan which is paid equally to every employee, regardless of salary. The amounts under this plan were $500 in fiscal 2009, $250 in fiscal 2010 and $1,800 in fiscal 2011. For Mr. Moquist, includes the value of postretirement benefits recieved in fiscal 2011. Mr. Moquist was not elegible for the Profit Plus Plan in fiscal 2011. | |||||||||||||
| (b) Represents reimbursement for health and wellness expenses and reduced health care premiums under the Company's Senior Executive Officer and Senior Manager benefit policies. | |||||||||||||
| (c) Includes, for Mr. Moquist, the leased value of a Company provided automobile, approximately $750 per month. | |||||||||||||
| Equity Compensation Plan Information | ||||||
| Plan Category | Number of securities to be issued upon exercise of outstanding options, warrants and rights (a) | Weighted-average exercise price of outstanding options, warrants and rights (b) | Number of securities remaining available for future issuance under equity compensation plans (excluding securities reflected in column(a)) | |||
| Equity compensation plans approved by security holders | 967,815 | $23.57 | 1,183,744 | |||
| Equity compensation plans not approved by security holders | — | — | — | |||
| Total | 967,815 | $23.57 | 1,183,744 | |||
18
| SUMMARY COMPENSATION TABLE | |||||||||||||
| Name and Principal Position | Fiscal Year | Salary | Stock Awards | Option Awards | Non-equity Incentive Plan Compensation | All Other Compensation | Total | ||||||
| ($) | ($) | ($) | ($) | ($) | ($) | ||||||||
(4) | (5) | (6) | (7) | ||||||||||
Daniel A. Rykhus (1) | 2013 | 460,000 | 399,993 | 403,218 | 193,752 | 41,922 | 1,498,885 | ||||||
| President and | 2012 | 387,500 | 663,240 | 387,500 | 31,973 | 1,470,213 | |||||||
| Chief Executive Officer | 2011 | 264,767 | 771,260 | 162,804 | 28,031 | 1,226,862 | |||||||
| Thomas Iacarella | 2013 | 230,000 | 164,986 | 166,546 | 62,970 | 38,527 | 663,029 | ||||||
| Vice President and | 2012 | 208,000 | 265,296 | 135,200 | 31,614 | 640,110 | |||||||
| Chief Financial Officer | 2011 | 194,400 | 198,204 | 105,754 | 27,481 | 525,839 | |||||||
| Matthew T. Burkhart | 2013 | 235,000 | 164,986 | 166,546 | 145,037 | 24,384 | 735,953 | ||||||
| Division Vice President | 2012 | 190,000 | 265,296 | 123,500 | 26,791 | 605,587 | |||||||
| Applied Technology Division | 2011 | 170,000 | 198,204 | 81,600 | 23,264 | 473,068 | |||||||
Anthony D. Schmidt (2) | 2013 | 190,000 | 129,975 | 131,484 | 106,320 | 20,421 | 578,200 | ||||||
| Division Vice President | |||||||||||||
| Engineered Films Division | |||||||||||||
Lon E. Stroschein (3) | 2013 | 210,000 | 129,975 | 131,484 | 13,268 | 25,117 | 509,844 | ||||||
| Division Vice President | 2012 | 175,000 | 221,080 | 113,750 | 20,331 | 530,161 | |||||||
| Aerostar Division | 2011 | 129,203 | 165,170 | 49,000 | 12,564 | 355,937 | |||||||
(1) Mr. Rykhus was named President and Chief Executive Officer on August 20, 2010, prior to that date he was Executive Vice President. | |||||||||||||
(2) Mr. Schmidt was named Engineered Films Division Vice President on February 1, 2012, prior to that date he held various other positions in Engineered Films and Applied Technology. | |||||||||||||
(3) Mr. Stroschein was named Aerostar Division Vice President on October 1, 2010, prior to that date he held various other positions in Aerostar and Applied Technology. | |||||||||||||
(4) Amounts shown reflect the aggregate fair value of restricted stock unit awards granted during the year based on achievement of targeted performance. Actual payments will be based on actual performance. The fair value of the awards based on achievement at or above the maximum performance level is as follows: Mr. Rykhus, $599,989; Mr. Iacarella, $247,479; Mr. Burkhart, $247,479; Mr. Schmidt, $194,963; Mr. Stroschein,$194,963. The fair values of the units are based on fair market value of the Company's common stock on the grant date. | |||||||||||||
(5) Amounts shown reflect the aggregate fair value of option awards granted during the year. Assumptions used in the calculation of this amount are included in Note 11 on pages 47 - 50 of the Company's Annual Report on Form 10-K. | |||||||||||||
19
(6) The following table describes the basis for payments under the annual management incentive plan. | |||||||||
| Name and Business Unit | Fiscal Year | Consolidated net income | Divisional income | Other factors | Total non-equity incentive plan compensation | ||||
(a) | (b) | ||||||||
| Daniel A. Rykhus | 2013 | 193,752 | N/A | N/A | 193,752 | ||||
| Entire Company | 2012 | 387,500 | N/A | N/A | 387,500 | ||||
| 2011 | 150,950 | N/A | 11,854 | 162,804 | |||||
| Thomas Iacarella | 2013 | 62,970 | N/A | N/A | 62,970 | ||||
| Entire Company | 2012 | 135,200 | N/A | N/A | 135,200 | ||||
| 2011 | 97,200 | N/A | 8,554 | 105,754 | |||||
| Matthew T. Burkhart | 2013 | 14,847 | 130,190 | N/A | 145,037 | ||||
| Applied Technology Division | 2012 | 28,500 | 95,000 | N/A | 123,500 | ||||
| 2011 | N/A | 81,600 | — | 81,600 | |||||
| Anthony D. Schmidt | 2013 | 12,004 | 94,316 | N/A | 106,320 | ||||
| Engineered Films Division | |||||||||
| Lon E. Stroschein | 2013 | 13,268 | — | N/A | 13,268 | ||||
| Aerostar Division | 2012 | 26,250 | 87,500 | N/A | 113,750 | ||||
| 2011 | N/A | 49,000 | N/A | 49,000 | |||||
(a) Operating income for the division less a charge for working capital utilization. | |||||||||
(b) Other factors include expense levels and inventory turns. | |||||||||
20
(7) The following table describes key components of the All Other Compensation column in the Summary Compensation Table. | |||||||||||
| Name | Fiscal Year | Retirement benefit and profit sharing plans | Supplemental health benefits | Other fringe benefits | Tax reimbursement on taxable fringe benefits | Total all other compensation | |||||
(a) | (b) | ||||||||||
| Daniel A. Rykhus | 2013 | 10,122 | 17,128 | 5,210 | 9,462 | 41,922 | |||||
| 2012 | 11,250 | 10,990 | 4,073 | 5,660 | 31,973 | ||||||
| 2011 | 11,992 | 9,265 | 3,372 | 3,402 | 28,031 | ||||||
| Thomas Iacarella | 2013 | 10,323 | 8,807 | 11,202 | 8,195 | 38,527 | |||||
| 2012 | 11,045 | 5,959 | 8,757 | 5,853 | 31,614 | ||||||
| 2011 | 9,747 | 5,813 | 8,081 | 3,840 | 27,481 | ||||||
| Matt T. Burkhart | 2013 | 10,400 | 9,448 | 1,445 | 3,091 | 24,384 | |||||
| 2012 | 11,067 | 10,781 | 1,349 | 3,594 | 26,791 | ||||||
| 2011 | 8,819 | 10,359 | 1,312 | 2,774 | 23,264 | ||||||
| Anthony D. Schmidt | 2013 | 4,830 | 10,715 | 1,385 | 3,491 | 20,421 | |||||
| Lon E. Stroschein | 2013 | 10,367 | 9,315 | 1,707 | 3,728 | 25,117 | |||||
| 2012 | 10,089 | 7,148 | 1,304 | 1,790 | 20,331 | ||||||
| 2011 | 6,976 | 4,092 | 1,120 | 376 | 12,564 | ||||||
(a) Represents the safe-harbor base and matching contributions under the Company's 401(k) plan. Also includes cash payments under the Company's Profit Plus plan which is paid equally to every employee, regardless of salary. The amounts under this plan were $1,800 in fiscal 2011, $1,200 in fiscal 2012 and $250 in fiscal 2013 | |||||||||||
(b) Represents reimbursement for health and wellness expenses and reduced health care premiums under the Company's Senior Executive Officer and Senior Manager benefit policies. | |||||||||||
21
| GRANTS OF PLAN BASED AWARDS IN FISCAL 2013 | ||||||||||||||||||||
| Name | Type of Award | Grant Date | Estimated Possible Payouts Under Non-Equity Incentive Plan Awards | Estimated Possible Payouts Under Equity Incentive Plan Awards | All Other Option Awards: Number of Securities Underlying Options | Exercise or Base Price of Option Awards | Grant Date Fair Value of Stock and Option Awards ($) | |||||||||||||
(2) | (3) | |||||||||||||||||||
| Threshold | Target | Maximum | Threshold | Target | Maximum | |||||||||||||||
(1) | ($) | ($) | ($) | (#) | (#) | (#) | (#) | ($/Share) | (4) | |||||||||||
| Daniel A. Rykhus | ||||||||||||||||||||
| MIP | 2/1/2012 | 0 | 360,332 | 552,000 | ||||||||||||||||
| RSU | 4/2/2012 | 6,318 | 12,636 | 18,954 | 399,993 | |||||||||||||||
| SO | 4/2/2012 | 36,800 | 31.655 | 403,218 | ||||||||||||||||
| Thomas Iacarella | ||||||||||||||||||||
| MIP | 2/1/2012 | 0 | 117,105 | 184,000 | ||||||||||||||||
| RSU | 4/2/2012 | 2,606 | 5,212 | 7,818 | 164,986 | |||||||||||||||
| SO | 4/2/2012 | 15,200 | 31.655 | 166,546 | ||||||||||||||||
| Matthew T. Burkhart | ||||||||||||||||||||
| MIP | 2/1/2012 | 0 | 119,653 | 188,000 | ||||||||||||||||
| RSU | 4/2/2012 | 2,606 | 5,212 | 7,818 | 164,986 | |||||||||||||||
| SO | 4/2/2012 | 15,200 | 31.655 | 166,546 | ||||||||||||||||
| Anthony D. Schmidt | ||||||||||||||||||||
| MIP | 2/1/2012 | 0 | 96,470 | 152,000 | ||||||||||||||||
| RSU | 4/2/2012 | 2,053 | 4,106 | 6,159 | 129,975 | |||||||||||||||
| SO | 4/2/2012 | 12,000 | 31.655 | 131,484 | ||||||||||||||||
| Lon E. Stroschein | ||||||||||||||||||||
| MIP | 2/1/2012 | 0 | 106,925 | 168,000 | ||||||||||||||||
| RSU | 4/2/2012 | 2,053 | 4,106 | 6,159 | 129,975 | |||||||||||||||
| SO | 4/2/2012 | 12,000 | 31.655 | 131,484 | ||||||||||||||||
(1) Type of award: MIP - Management Incentive Plan; RSU - Restricted Stock Unit; SO - Stock Option. | ||||||||||||||||||||
(2) These columns represent the range of payouts under three scenarios. The threshold amounts represent the amounts paid if the minimum performance criteria is achieved. No payments are made under the plans if earnings fall by 20% or more. The plan targets payouts at approximately 65% of the maximum. In the case of Mr. Rykhus, this would represent profit growth of approximately 10% over the prior year. Maximum payouts assume growth beyond the targeted level and are capped at 23% growth at the amounts shown. Actual amounts paid are outlined in note 6 of the Summary Compensation table on page 19. | ||||||||||||||||||||
(3) These columns represent the range of performance shares to be awarded under three scenarios. The threshold amounts represent the number of performance based shares to be awarded when restricted stock units (RSU's) vest if the minimum performance criteria is achieved. No performance based restricted stock units vest under the plan if the three year average return on sales is less than a minimum level. The percentage of performance based shares issued at plan target is approximately 66.7% of the maximum. | ||||||||||||||||||||
(4) Option awards reflect the Black-Scholes value of $10.597 as of 4/2/2012. All awards vest in equal installments over 4 years and expire after 5 years. RSU's are valued at the targeted performance level and the closing stock price of $31.655 on 4/2/2012, the date of grant. | ||||||||||||||||||||
22
Estimated Possible Payouts Under Non-Equity Incentive Plan Awards (2) | All other Option Awards: Number of Securities Underlying Options | Exercise or Base Price of Option Awards | Grant Date Fair Value of Stock and Option Awards | ||||||||||||||||||||||||||
| Name | Type of Award | Grant Date | Threshold | Target | Maximum | ||||||||||||||||||||||||
| ($) | ($) | ($) | (#) | ($/Share) | ($) | ||||||||||||||||||||||||
(1) | (3) | ||||||||||||||||||||||||||||
| Daniel A. Rykhus | MIP | 2/1/2010 | 26,940 | 106,734 | 177,890 | ||||||||||||||||||||||||
| SO | 8/20/2010 | 25,000 | 30.97 | 275,750 | |||||||||||||||||||||||||
| SO | 11/30/2010 | 30,000 | 44.40 | 495,510 | |||||||||||||||||||||||||
| Thomas Iacarella | MIP | 2/1/2010 | 11,664 | 69,984 | 116,640 | ||||||||||||||||||||||||
| SO | 11/30/2010 | 12,000 | 44.40 | 198,204 | |||||||||||||||||||||||||
| David R. Bair | MIP | 2/1/2010 | 3,446 | 21,687 | 86,150 | ||||||||||||||||||||||||
| SO | 11/30/2010 | 8,000 | 44.40 | 132,136 | |||||||||||||||||||||||||
| Matthew T. Burkhart | MIP | 2/1/2010 | 3,400 | 38,266 | 85,000 | ||||||||||||||||||||||||
| SO | 11/30/2010 | 12,000 | 44.40 | 198,204 | |||||||||||||||||||||||||
| James D. Groninger | MIP | 2/1/2010 | 3,508 | 17,535 | 87,700 | ||||||||||||||||||||||||
| SO | 11/30/2010 | 12,000 | 44.40 | 198,204 | |||||||||||||||||||||||||
| Ronald M. Moquist | MIP | 2/1/2010 | 42,000 | 147,000 | 245,000 | ||||||||||||||||||||||||
| (1 | ) | Type of award: MIP - Management Incentive Plan; SO - Stock Option. | |||||||||||||||||||||||||||
| (2 | ) | These columns represent the range of payouts under three scenarios. The threshold amounts represent the amounts paid if the minimum performance criteria is achieved for every component of the incentive. The targeted amounts would be paid if the performance was at the level budgeted by the Company for fiscal year 2011. Maximum payouts assume beyond budgeted performance and are capped at the amounts shown. Actual amounts paid are outlined in note 6 of the Summary Compensation Table on page 20. | |||||||||||||||||||||||||||
| (3 | ) | Option awards reflect the Black-Scholes values of $11.28 as of 8/20/10 and $16.52 as of 11/30/10 used for expensing options in the Company's income statement. All awards vest in equal installments over 4 years and expire after 5 years. The option price may be paid in cash or by the delivery of shares of the Company's common stock, valued at the market price on the date of the option exercise. | |||||||||||||||||||||||||||
| OUTSTANDING EQUITY AWARDS AT FISCAL 2013 YEAR-END | |||||||||||||
| Name | Option Awards (1) | Stock Awards (2) | |||||||||||
| Grant Date | Number of Securities Underlying Unexercised Options | Number of Securities Underlying Unexercised Options | Option Exercise Price | Option Expiration Date | Equity Incentive Plan Awards: Number of Unearned Shares, Units or Other Rights That Have Not Vested | Equity Incentive Plan Awards: Market or Payout Value of Unearned Shares, Units or Other Rights That Have Not Vested | |||||||
| (#) | (#) | ||||||||||||
| Exercisable | Unexercisable | ($) | (#) | ($) | |||||||||
| Daniel A. Rykhus | 12/5/2008 | 18,800 | — | 12.255 | 12/5/2013 | ||||||||
| 12/4/2009 | 13,200 | 4,400 | 15.025 | 12/4/2014 | |||||||||
| 8/20/2010 | 25,000 | 25,000 | 15.485 | 8/20/2015 | |||||||||
| 11/30/2010 | 30,000 | 30,000 | 22.200 | 11/30/2015 | |||||||||
| 12/6/2011 | 15,000 | 45,000 | 29.995 | 12/6/2016 | |||||||||
| 4/2/2012 | — | 36,800 | 31.655 | 4/2/2017 | 18,954 | 510,431 | |||||||
| Thomas Iacarella | 12/5/2008 | 18,800 | — | 12.255 | 12/5/2013 | ||||||||
| 12/4/2009 | 11,625 | 3,875 | 15.025 | 12/4/2014 | |||||||||
| 11/30/2010 | 12,000 | 12,000 | 22.200 | 11/30/2015 | |||||||||
| 12/6/2011 | 6,000 | 18,000 | 29.995 | 12/6/2016 | |||||||||
| 4/2/2012 | — | 15,200 | 31.655 | 4/2/2017 | 7,818 | 210,539 | |||||||
| Matthew T. Burkhart | 12/5/2008 | 2,702 | — | 12.255 | 12/5/2013 | ||||||||
| 12/4/2009 | 8,319 | 3,275 | 15.025 | 12/4/2014 | |||||||||
| 11/30/2010 | 12,000 | 12,000 | 22.200 | 11/30/2015 | |||||||||
| 12/6/2011 | 6,000 | 18,000 | 29.995 | 12/6/2016 | |||||||||
| 4/2/2012 | — | 15,200 | 31.655 | 4/2/2017 | 7,818 | 210,539 | |||||||
| Anthony D. Schmidt | 12/5/2008 | 4,800 | — | 24.510 | 12/5/2013 | ||||||||
| 12/4/2009 | 3,000 | 1,000 | 30.050 | 12/4/2014 | |||||||||
| 11/30/2010 | 2,000 | 2,000 | 22.200 | 11/30/2015 | |||||||||
| 12/6/2011 | 4,000 | 12,000 | 29.995 | 12/6/2016 | |||||||||
| 4/2/2012 | — | 12,000 | 31.655 | 4/2/2017 | 6,159 | 165,862 | |||||||
| Lon E. Stroschein | 12/5/2008 | 900 | — | 12.255 | 12/5/2013 | ||||||||
| 12/4/2009 | 1,828 | 800 | 15.025 | 12/4/2014 | |||||||||
| 11/30/2010 | 10,000 | 10,000 | 22.200 | 11/30/2015 | |||||||||
| 12/6/2011 | 5,000 | 15,000 | 29.995 | 12/6/2016 | |||||||||
| 4/2/2012 | — | 12,000 | 31.655 | 4/2/2017 | 6,159 | 165,862 | |||||||
(1) All options vest in equal installments over 4 years and expire after 5 years. | |||||||||||||
(2) Represents the number of performance based restricted stock units (RSU's) that will vest and be paid out in Raven Common Stock if the three year average return on sales reaches a specified level. The maximum level was used as it represents the next highest level (threshold, target or maximum) to our actual period-to-date performance. The percentage of shares to be paid to the Executive based on RSU's vesting at the plan target is approximately 66.7% of the maximum. The payout value is based on the company's stock price of $26.93 at January 31, 2013. | |||||||||||||
| OPTION EXERCISES IN FISCAL 2013 | |||||
| Name | Option Awards | ||||
| Number of Shares Acquired on Exercise | Value Realized on Exercise | ||||
| (#) | ($) | ||||
| Daniel A. Rykhus | 12,800 | 184,384 | |||
| Thomas Iacarella | 12,800 | 201,979 | |||
| Matt T. Burkhart | 8,164 | 170,153 | |||
| Anthony D. Schmidt | 4,000 | 65,780 | |||
| Lon E. Stroschein | 2,372 | 50,030 | |||
23
Option Awards (1) | ||||||||||||||||
| Name | Grant Date | Number of Securities Underlying Unexercised Options | Number of Securities Underlying Unexercised Options | Option Exercise Price | Option Expiration Date | |||||||||||
| (#) | (#) | ($) | ||||||||||||||
| Exercisable | Unexercisable | |||||||||||||||
| Daniel A. Rykhus | 11/20/2006 | 7,200 | - | 28.01 | 11/20/2011 | |||||||||||
| 11/19/2007 | 4,800 | 1,600 | 34.50 | 11/19/2012 | ||||||||||||
| 12/5/2008 | 4,700 | 4,700 | 24.51 | 12/5/2013 | ||||||||||||
| 12/4/2009 | 2,200 | 6,600 | 30.05 | 12/4/2014 | ||||||||||||
| 8/20/2010 | - | 25,000 | 30.97 | 8/20/2015 | ||||||||||||
| 11/30/2010 | - | 30,000 | 44.40 | 11/30/2015 | ||||||||||||
| Thomas Iacarella | 11/20/2006 | 7,500 | - | 28.01 | 11/20/2011 | |||||||||||
| 11/19/2007 | 4,800 | 1,600 | 34.50 | 11/19/2012 | ||||||||||||
| 12/5/2008 | 4,700 | 4,700 | 24.51 | 12/5/2013 | ||||||||||||
| 12/4/2009 | 1,938 | 5,812 | 30.05 | 12/4/2014 | ||||||||||||
| 11/30/2010 | - | 12,000 | 44.40 | 11/30/2015 | ||||||||||||
| David R. Bair | 11/19/2007 | 4,050 | 1,350 | 34.50 | 11/19/2012 | |||||||||||
| 12/5/2008 | 3,700 | 3,700 | 24.51 | 12/5/2013 | ||||||||||||
| 12/4/2009 | 1,500 | 4,500 | 30.05 | 12/4/2014 | ||||||||||||
| 11/30/2010 | - | 8,000 | 44.40 | 11/30/2015 | ||||||||||||
| Matthew T. Burkhart | 11/19/2007 | - | 300 | 34.50 | 11/19/2012 | |||||||||||
| 12/5/2008 | 2,700 | 2,700 | 24.51 | 12/5/2013 | ||||||||||||
| 12/4/2009 | 1,638 | 4,912 | 30.05 | 12/4/2014 | ||||||||||||
| 11/30/2010 | - | 12,000 | 44.40 | 11/30/2015 | ||||||||||||
| James D. Groninger | 11/20/2006 | 1,625 | - | 28.01 | 11/20/2011 | |||||||||||
| 11/19/2007 | 4,425 | 1,475 | 34.50 | 11/19/2012 | ||||||||||||
| 12/5/2008 | 4,150 | 4,150 | 24.51 | 12/5/2013 | ||||||||||||
| 12/4/2009 | 1,675 | 5,025 | 30.05 | 12/4/2014 | ||||||||||||
| 11/30/2010 | - | 12,000 | 44.40 | 11/30/2015 | ||||||||||||
| Ronald M. Moquist | 11/19/2007 | 8,850 | 2,950 | 34.50 | 11/19/2012 | |||||||||||
| (1) All options vest in equal installments over 4 years and expire after 5 years. | ||||||||||||||||
| OPTION EXERCISES IN FISCAL 2011 | ||||||||||||
| Option Awards | ||||||||||||
| Name | Number of Shares Acquired on Exercise | Value Realized on Exercise | ||||||||||
| (#) | ($) | |||||||||||
| Daniel A. Rykhus | 6,800 | 38,284 | ||||||||||
| Thomas Iacarella | 7,000 | 39,410 | ||||||||||
| David R. Bair | 11,700 | 147,651 | ||||||||||
| Matthew T. Burkhart | 900 | 12,294 | ||||||||||
| James D. Groninger | 11,075 | 83,042 | ||||||||||
| Ronald M. Moquist | 27,000 | 298,310 | ||||||||||
POTENTIAL PAYMENTS ON TERMINATION OR CHANGE IN CONTROL
The following table shows the payments and benefits that the Named Executives would receive in connection with a variety of employment termination scenarios and upon a change in control of Raven. The information assumes that termination occurred on January 31, 2011, except that for Mr. Moquist the data is as of August 20, 2010, his retirement date.2013. Raven would provide all of the payments. There are no assets set aside for these benefits. The Named Executives must comply with confidentiality and non-competition provisions of the agreements to retain benefits.
The table does not include amounts otherwise due to the executives, such as earned but unpaid salary, bonus and vacation pay and benefits that would accrue to any salaried employee. The table does include the value of unvested stock options and restricted stock units (RSU's), which would vest upon a change in control orfor the Named Executives, as they would vest for all of Raven's other key employees, under the 2010 Stock Incentive Plan. In addition, unvested stock options vest upon retirement for the Named Executives, as they would vest for all of Raven’sRaven's other key employees. For Mr. Moquist, all amounts included inRSU's vest on a pro-rata basis for employees who retire 12 months after the table below are also included in the Summary Compensation Table on page 20.grant date.
Termination other than for a change in control is governed by employment agreements with the executives. These agreements require 30 days written notice before termination can occur. They also have retirement provisions that, if the executive’sexecutive's years of employment and age added together exceed 80, allow for early retirement. Early retirement triggers post-retirement benefits under the employment agreement. Retiring executives retain health care and other insurance benefits. The retired executive will be reimbursed for health expenditures up to a percentage (10% for Messrs. Rykhus Moquist and Iacarella, 3.5% for others) of the executive’sexecutive's highest salary and bonus over the last five years of employment. Retirement benefits continue until the last to die of the executive or spouse. In the case of Messrs. Rykhus Moquist and Iacarella, the benefits are “grossed-up” for income tax purposes. Other than Mr. Moquist, none of the Named Executives was eligible for retirement benefits at January 31, 2011. In the event of an executive’sexecutive's death, the benefits available to the surviving spouse would be limited to vested retirement benefits.
Raven has Change in Control agreements with the Named Executives. A “Change in Control” includes (a) the acquisition by any person, entity or group of beneficial ownership of 25% or more of the then outstanding shares of Raven common stock; (b) certain changes in a majority of the members of our Board of Directors, or (c) approval by the shareholders of a reorganization, merger or consolidation (with certain exceptions), or of a liquidation, dissolution or sale of all or substantially all of Raven’sRaven's assets.
For the executives to obtain benefits under the Change in Control agreements, a second triggering event must occur. This would include a termination without cause or a constructive termination (an adverse change in the officer’sofficer's status or compensation). The benefits include a lump sum payment equal to the product of (A) the sum of (i) the employee’semployee's annual base salary then in effect and (ii) 60% of the maximum target or goal amount under the Management Incentive Plan for the year in which the date of termination occurs and (B) a multiple of 2.0 for Messrs. Rykhus and Iacarella, or 1.0 for others. The executive also vests under the applicable retirement benefits policy; provided that the benefits (A) will not become payable until the employee reaches age 65 (unless the benefits are payable at the employee’semployee's age at that time under the terms of the policy), and (B) will not be provided to the extent such benefits are provided by another employer at no cost to the employee.
24
| Name | Type of Separation | Lump-sum benefits | Annual Benefits (1) | |||||||||||||||
| Salary and Incentives | Value of Non-vested Stock Options | Value of Non-vested RSU's at Target | Total Lump-sum Benefits | Continued Insurance Coverage | Maximum Supplemental Health Benefits | Maximum Tax Reimbursement on Benefits | Total Maximum Annual Benefits | |||||||||||
| ($) | ($) | ($) | ($) | ($) | ($) | ($) | ($) | |||||||||||
(2) | (3) | (3) | ||||||||||||||||
| Daniel A. Rykhus | Without Cause | 38,333 | — | — | 38,333 | — | — | — | — | |||||||||
| For Cause | — | — | — | — | — | — | — | — | ||||||||||
| Change in Control | 1,472,000 | 480,407 | 340,287 | 2,292,694 | 15,084 | 77,500 | 50,811 | 143,395 | ||||||||||
| Thomas Iacarella | Without Cause | 19,167 | 102,892 | — | 122,059 | 17,549 | 34,320 | 22,501 | 74,370 | |||||||||
| For Cause | — | — | — | — | — | — | — | — | ||||||||||
| Retirement | — | 102,892 | — | 102,892 | 17,549 | 34,320 | 22,501 | 74,370 | ||||||||||
| Change in Control | 680,800 | 102,892 | 140,359 | 924,051 | 17,549 | 34,320 | 22,501 | 74,370 | ||||||||||
| Matthew T. Burkhart | Without Cause | 19,583 | — | — | 19,583 | — | — | — | — | |||||||||
| For Cause | — | — | — | — | — | — | — | — | ||||||||||
| Change in Control | 347,800 | 95,749 | 140,359 | 583,908 | 15,084 | 13,464 | — | 28,548 | ||||||||||
| Anthony D. Schmidt | Without Cause | 15,833 | — | — | 15,833 | — | — | — | — | |||||||||
| For Cause | — | — | — | — | — | — | — | — | ||||||||||
| Change in Control | 281,200 | 21,365 | 110,575 | 413,140 | 15,084 | 10,354 | — | 25,438 | ||||||||||
| Lon E. Stroschein | Without Cause | 17,500 | — | — | 17,500 | — | — | — | — | |||||||||
| For Cause | — | — | — | — | — | — | — | — | ||||||||||
| Change in Control | 310,800 | 56,824 | 110,575 | 478,199 | 15,084 | 10,106 | — | 25,190 | ||||||||||
(1) Annual benefits would begin immediately for executives eligible for retirement (Mr. Iacarella) and at age 65 for the other executives. They would continue until the last to die of the executive or spouse. | ||||||||||||||||||
(2) Based on the current cost of the benefit. The program provides that the retiree will pay no more than active executives for coverage. | ||||||||||||||||||
(3) Represents the annual limit for reimbursement. Actual expenses submitted to the plan may be less. | ||||||||||||||||||
25
| Lump-sum benefits | Annual Benefits (1) | ||||||||||||||||||||||
| Name | Type of Separation | Salary and Incentives | Value of Unvested Stock Options | Total Lump-sum Benefits | Continued Insurance Coverage | Maximum Supplemental Health Benefits | Maximum Tax Reimbursement on Benefits | Maximum Annual Benefits | |||||||||||||||
| ($) | ($) | ($) | ($) | ($) | ($) | ($) | |||||||||||||||||
| (2) | (3) | (3) | |||||||||||||||||||||
| Daniel A. Rykhus | Without Cause | 27,083 | - | 27,083 | - | - | - | - | |||||||||||||||
| For Cause | - | - | - | - | - | - | - | ||||||||||||||||
| Retirement | - | - | - | - | - | - | - | ||||||||||||||||
| Change in Control | 923,000 | 732,619 | 1,655,619 | 14,432 | 42,757 | 23,023 | 80,212 | ||||||||||||||||
| Thomas Iacarella | Without Cause | 16,200 | - | 16,200 | - | - | - | - | |||||||||||||||
| For Cause | - | - | - | - | - | - | - | ||||||||||||||||
| Retirement | - | - | - | - | - | - | - | ||||||||||||||||
| Change in Control | 528,768 | 261,212 | 789,980 | 11,386 | 30,015 | 16,162 | 57,563 | ||||||||||||||||
| David R. Bair | Without Cause | 14,358 | - | 14,358 | - | - | - | - | |||||||||||||||
| For Cause | - | - | - | - | - | - | - | ||||||||||||||||
| Retirement | - | - | - | - | - | - | - | ||||||||||||||||
| Change in Control | 223,990 | 201,375 | 425,365 | 14,432 | 8,925 | - | 23,357 | ||||||||||||||||
| Matthew T. Burkhart | Without Cause | 14,167 | - | 14,167 | - | - | - | - | |||||||||||||||
| For Cause | - | - | - | - | - | - | - | ||||||||||||||||
| Retirement | - | - | - | - | - | - | - | ||||||||||||||||
| Change in Control | 221,000 | 183,719 | 404,719 | 14,432 | 8,806 | - | 23,238 | ||||||||||||||||
| James D. Groninger | Without Cause | 14,616 | - | 14,616 | - | - | - | - | |||||||||||||||
| For Cause | - | - | - | - | - | - | - | ||||||||||||||||
| Retirement | - | - | - | - | - | - | - | ||||||||||||||||
| Change in Control | 228,020 | 233,581 | 461,601 | 14,432 | 9,209 | - | 23,641 | ||||||||||||||||
| Ronald M. Moquist | Retirement 8/20/10 (4) | 10,000 | 10,360 | 20,360 | 15,036 | 48,443 | 26,085 | 89,564 | |||||||||||||||
| (1) | Annual benefits would begin at age 65 for active executives. They would continue until the last to die of the executive or spouse. | ||||||||||||||||||||||
| (2) | Based on the current cost of the benefit. The program provides that the retiree will pay no more than active executives for coverage. | ||||||||||||||||||||||
| (3) | Represents the annual limit for reimbursement. Actual expenses submitted to the plan may be less. | ||||||||||||||||||||||
| (4) | Mr. Moquist retired on August 20, 2010. Mr. Moquist's retirement benefits paid during fiscal 2011 are also included in the Summary Compensation Table, along with tax reimbursement related to the future value of taxable benefits, which was taxable currently. This amount was $7,803. The value of unvested stock options was computed as of August 20, 2010. | ||||||||||||||||||||||
3INDEPENDENT REGISTERED PUBLIC ACCOUNTING FIRM FEES
PricewaterhouseCoopers LLP served as the Company’sCompany's independent registered public accounting firm during fiscal 2011.2013. The Company’sCompany's Audit Committee has engaged PricewaterhouseCoopers LLP to perform the annual audit and three quarterly reviews in fiscal 2012.2014. The aggregate fees billed by PricewaterhouseCoopers LLP for fiscal 20112013 and 20102012 are presented in the following table:
| 2011 | 2010 | ||
Audit (1) | $352,500 | $343,500 | |
Audit related (2) | 750 | 5,000 | |
Tax services (3) | 15,207 | 15,950 | |
| Total Fees | $368,457 | $364,450 |
| 2013 | 2012 | ||||||
Audit (1) | $ | 396,500 | $ | 409,000 | |||
Audit related (2) | 4,100 | — | |||||
Tax Services (3) | 30,900 | 14,000 | |||||
| Total Fees | $ | 431,500 | $ | 423,000 | |||
| All items included in the above fee summary were subject to Audit Committee pre-approval. Such approval was obtained from the Committee or the Chair of the Committee prior to services performed and/or billing of services. | |||||||
(1) Total fees for the financial statement audit were in accordance with the respective engagement letters and include timely quarterly reviews. Fiscal 2012 fees include billings for purchase accounting audit procedures related to Vista Research. Billings for out-of pocket expenses are not included. | |||||||
(2) Audit related billings include review of the Company's S-8 filing and SEC comment letter. | |||||||
(3) Tax services include the review of corporate income tax filings and due diligence support. | |||||||
26